Home / Simulations / Pushover & Target Displacement
📈 Pushover & Target Displacement
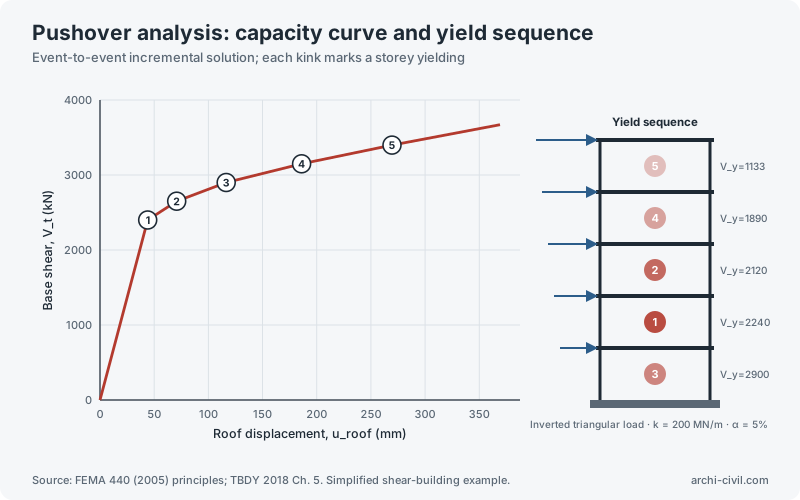
Force-based design asks whether the structure is strong enough. Performance-based design asks a harder question: how far will it actually move, and can it survive moving that far? Push the building over, idealize the capacity curve, and find where the demand and the capacity meet.
Capacity
Demand
Live Result
—
Equivalent SDOF period T*—
Elastic displacement demand De*—
Reduction factor qu—
Target displacement Dt*—
Ductility demand μ—
N2 branch applied—
Powered by the N2 method
(
engine/pushover.js). Verified before publishing: the equivalent
SDOF period matches an independent 2π√(m*/k*) evaluation exactly, the
equal-displacement rule is confirmed to hold to machine precision in the
long-period branch, the short-period branch is confirmed never to fall below
the elastic demand, and the equal-energy bilinear idealization is verified to
recover the true yield point of an elastic–perfectly-plastic curve exactly. A
perfectly linear (never-yielding) capacity curve is rejected rather
than idealized into a degenerate zero-ductility result.Method
Fajfar (2000)N2 method — equal-displacement rule for T* ≥ TC, amplification for T* < TC.
EN 1998-1 Annex BEquivalent SDOF conversion and equal-energy bilinear idealization; reflected in TBDY 2018 Chapter 5.
Scope: first-mode-dominated response only — the N2 method does not capture higher-mode effects, which matter for tall or irregular buildings. Assumes a monotonic, non-degrading capacity curve with no cyclic strength or stiffness degradation.
Visual explanation